Help centre / Account
Dashboard: read your reports
What the cards and charts on the Dashboard tell you, and what to do about them.
Last reviewed 2026-11-13
The Dashboard looks at the prices you saved and tells you in one sentence if they are healthy. Everything is worked out from your own saved calculations.
A tour of the Dashboard
Short video, coming soon. The steps above show the same thing.
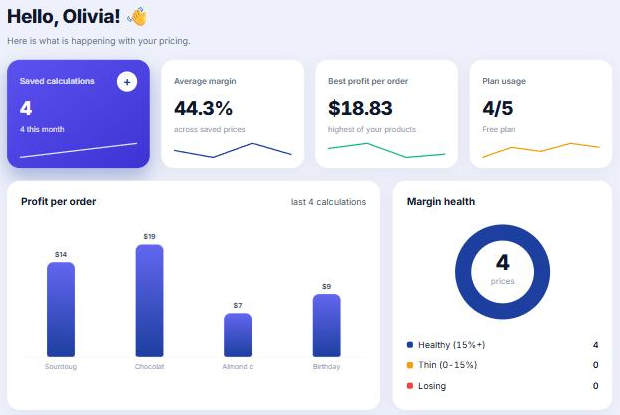
How to read it
- The coloured line at the top is the verdict: green means healthy, amber means some prices are thin, red means some lose money.
- Average price and Average profit: what you charge and keep per order, on average.
- Healthy share: the share of your prices that earn at least your thin-margin limit.
- Fix these first: your lowest margins. Press a name to open it and change the price.
- Your best earners: the products worth promoting.
- Prices saved by month: how active you were over six months.
Tip. Change what counts as thin in Settings, under Warnings.